Сustomer: Minsk City Executive Committee, Information Technology Center.
Project Overview
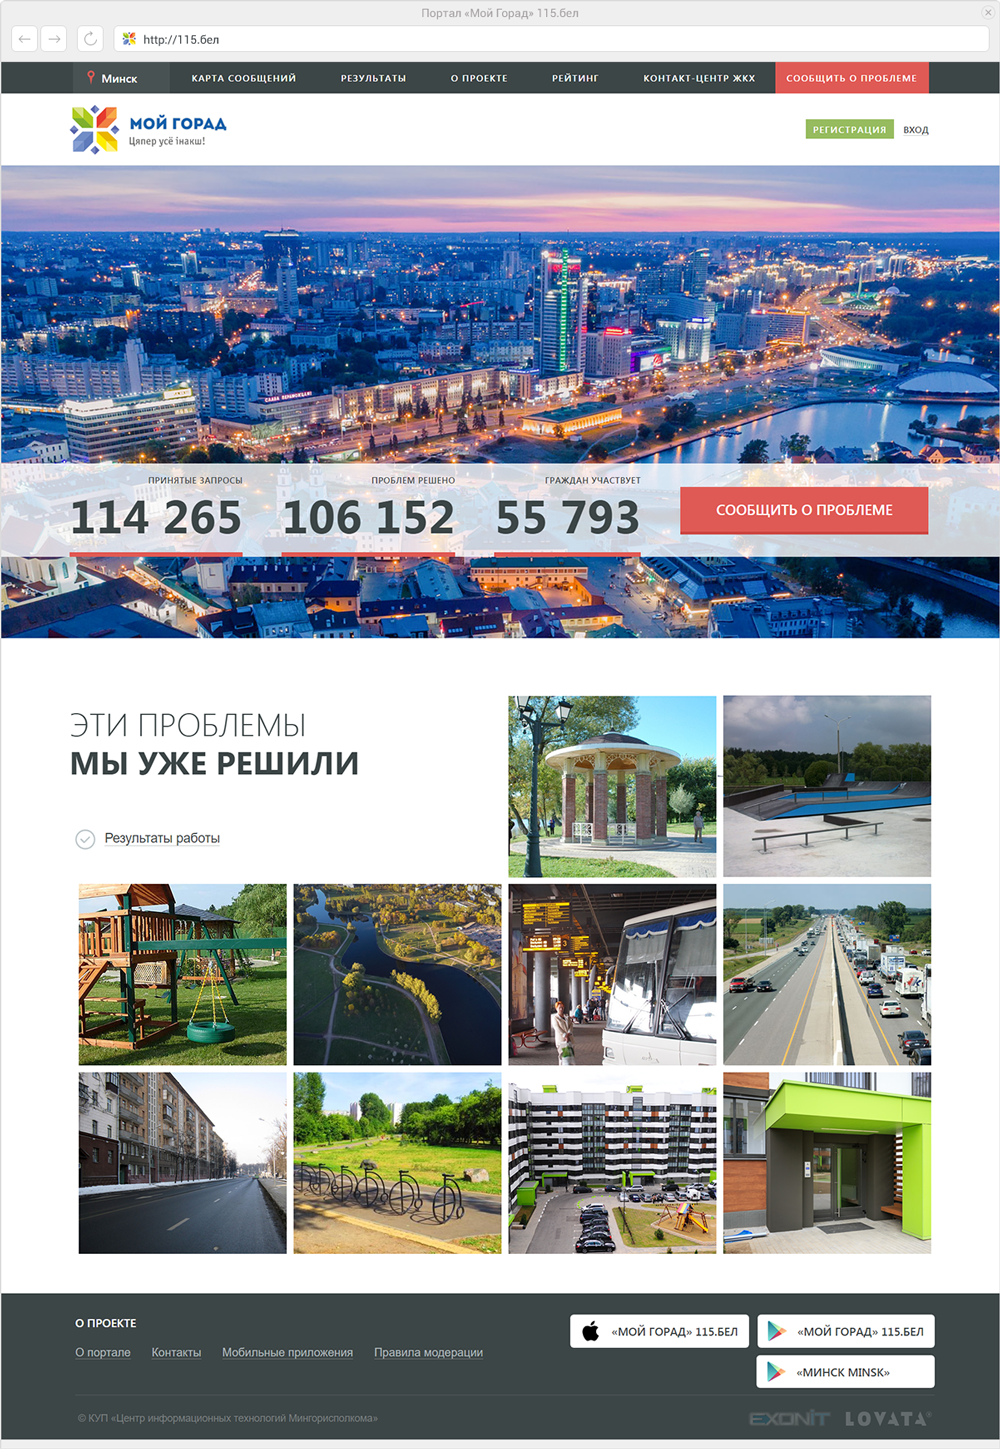
‘My City’ Portal is a unique project, developed with an ultimate goal to improve citizens’ living conditions and the overall look of Minsk city and its neighborhoods by engaging citizens to actively participate in the life of their community.
Another goal of the project was to give government officials a convenient way to monitor the effectiveness of work of state agencies and to improve the quality of services they provide.
-
The Problem
Municipal services and organizations are mostly under direct control of the government in the Republic of Belarus. Historically, this led to problems with slow reaction to arising needs for proper maintenance of roads, sidewalks, parks and overall infrastructure and buildings’ sanitary conditions.
It was decided to create a reliable Geographic Information service aimed at receiving online requests from citizens regarding municipal and housing issues in their communities.
-
The Solution
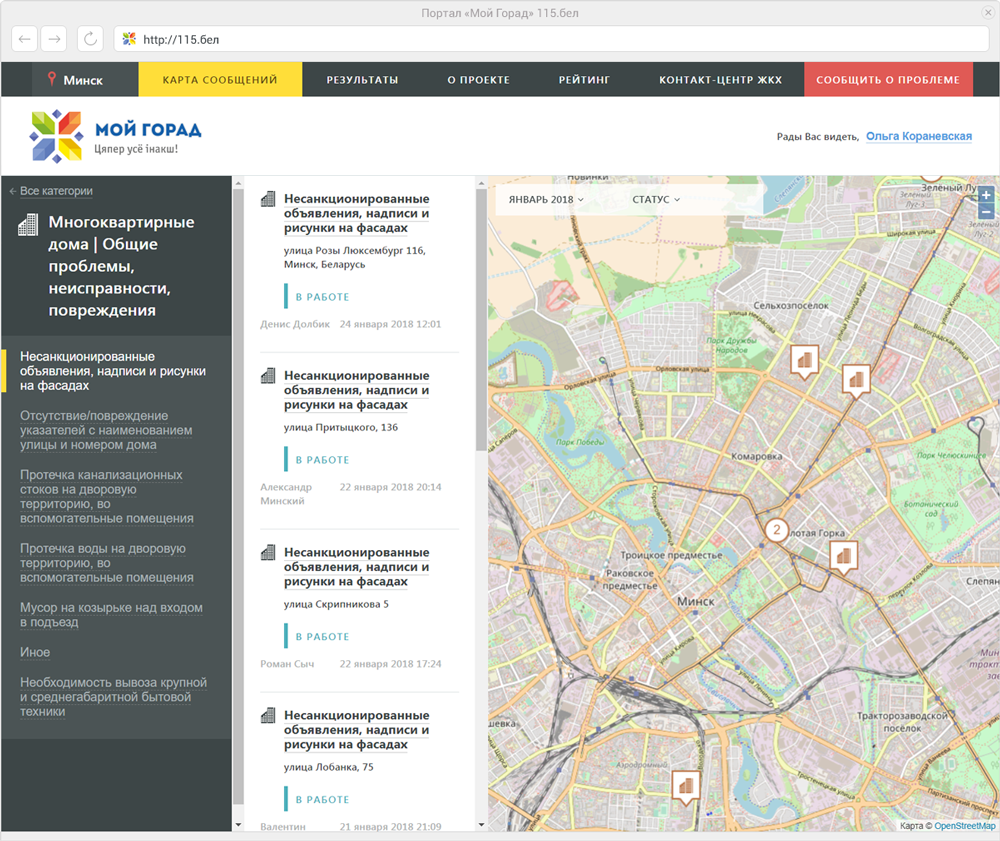
The portal allows citizens to send requests on issues regarding municipal and housing services.
The completion report, sent by a representative of an assigned municipal organization within 7 working days, contains information regarding the work that has been completed to solve the problem and the timeline, starting from the moment the issue was posted on the website. This information is presented in the form of a “before and after” report.
The portal is also used by government officials to monitor the state of infrastructure, trafficways, transport junctions, outdoor lighting, cleaning and gathering garbage, landscaping and development, etc.
How does this work?
-
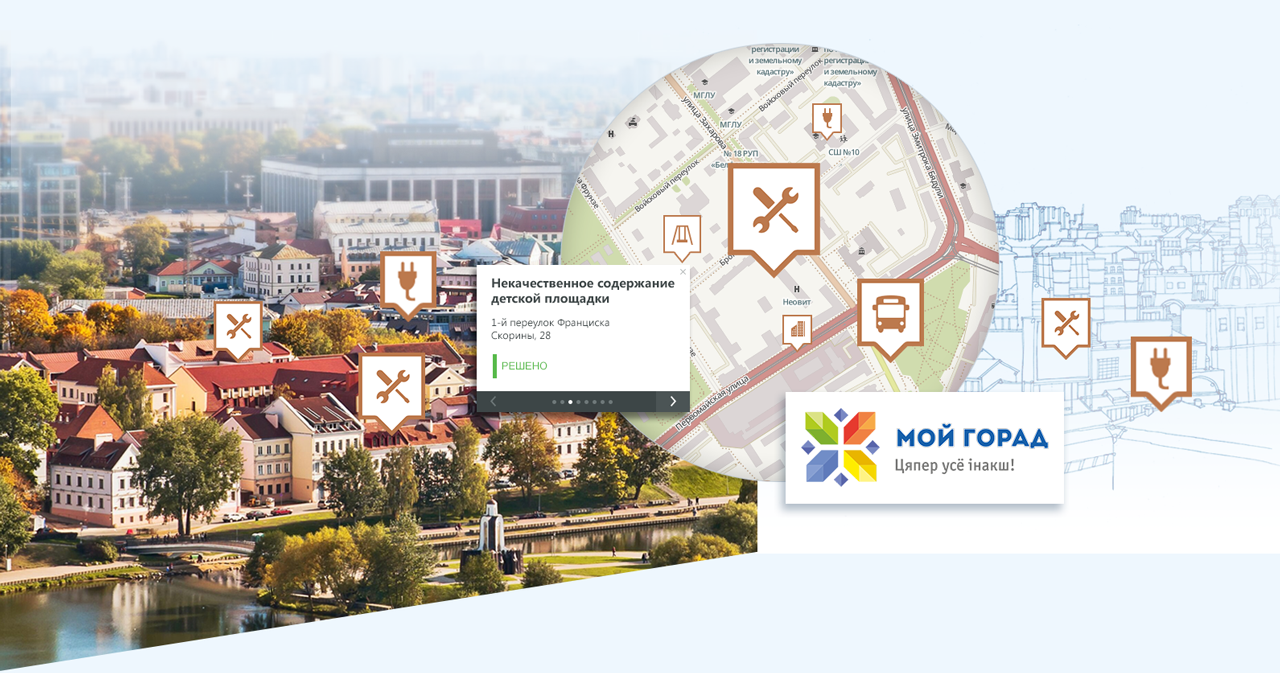
Issue Discovery
Once a problem that needs to be fixed is discovered, a user takes a picture of the issue and records its location.
-
Issue Reporting
The user then prepares a request to fix the issue by attaching the image to a short form with its description and exact location. This can be done through the website or via iOS or Android app.
-
Moderation
The request goes through moderation and is then forwarded to appropriate municipal agency. The user is notified that the issue is scheduled to be resolved.
-
Issue resolved
The agency assigns appropriate staff that travel to the site to fix the issue. Once the job is done, the workers take a picture of the resolved issue and upload it to the system.
-
Report
A report is generated and uploaded to the website in before/after format.
-
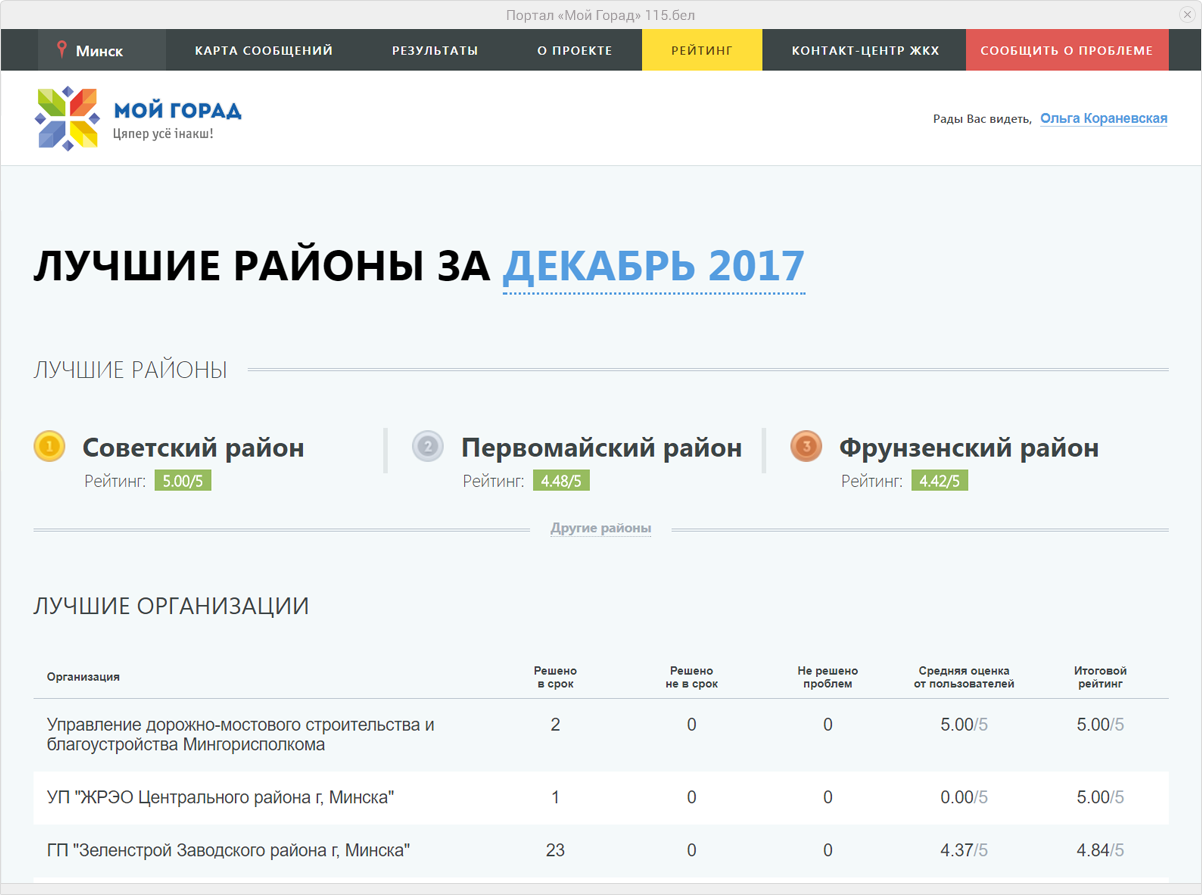
Rating and comment
The user receives notification and is able to rate the work by leaving a comment and a star rating on a scale from 1 to 5. The requests are usually taken care of within 7 working days.

Before

After
The Results
The developed e-government service eliminated the need to contact municipal organizations directly or searching for appropriate specialists and persons that are responsible for proper maintenance of city’s property and infrastructure.
-
REQUESTS ACCEPTED
126 371
-
PROBLEMS SOLVED
116 702
-
PARTICIPATING CITIZENS
58 898
Regular residents started to actively help municipal organizations of Minsk city to identify infrastructure maintenance issues. Additionally, citizens can now influence the ratings of municipal organizations, judging them by the quality of the work that has been completed. All this lead to issues being eliminated quickly and efficiently.
My City Portal as a Part of Country’s E- government Information System
The project started as an initiative for the city of Minsk, but is currently being modernized, and is expected to cover the whole country of Belarus, including all inner cities.
Performance Optimization
To provide quick access to massive arrays of data, the data is being cached directly to the server’s RAM using a non-relational database management system, Redis. In addition, the cache is being divided into logical marked fields, which allows updating only the edited data without fully clearing it. This provides the opportunity to avoid executing resourceful tasks that can decrease project’s performance.
To maintain project’s stable performance, background tasks are implemented through the Beanstalkd queue. “Long” tasks are divided into simple ones whenever possible and are executed through a general queue depending on specified priority.
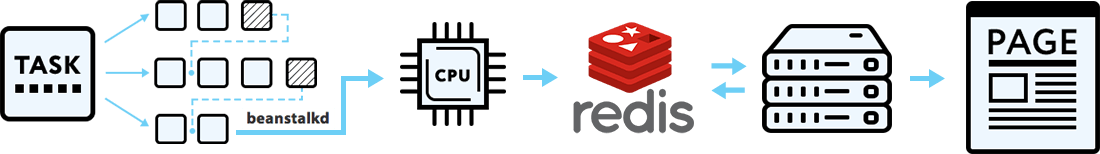
Performance Optimization Diagram
Project’s Components
The project comprises of four physical network nodes:
-
Balancing node
The balancing node serves the purpose of managing the load between two mirrored production-servers of the project. The load balancing algorithm used is Roundrobin. Requests are being sent to servers in a rotating sequential manner. This way, when a certain server node goes down, the other one takes all the load.
-
Customer Relations Management (CRM) System
The service is integrated with SugarCRM system. Synchronization with the CRM is executed on schedule using the expansion for CL-interface of cURL micro-service.
-
Geographic Information System (GIS) server
The portal interacts with the OSM layers located on a separate GIS server using a custom API.
-
Server (master and slave)
The server communicates with the system's CRM and exchanges data. It transfers new user requests and user info to the CRM. It also receives new info on requests and users from the CRM when this data is updated (e.g. via mobile app).